서비스 모니터링을 위한 그라파나와 프로메테우스 설정
in Etc on Etc
Micrometer
- https://micrometer.io/
- JVM기반의 애플리케이션의 Metrics 제공
- Spring5, 스프링부트2 부터 Spring의 Metrics 처리
- Prometheus등의 다양한 모니터링 시스템 지원
Timer
- 짧은 지연 시간, 이벤트의 사용 빈도를 측정
- 시계열로 이벤트의 시간, 호출 빈도 등을 제공
- @Timed 어노테이션 제공
의존성 추가
    implementation 'org.springframework.boot:spring-boot-starter-actuator'
    implementation 'io.micrometer:micrometer-registry-prometheus'
yml
management:
  endpoints:
    web:
      exposure:
        include: metrics, prometheus
@Timed 어노테이션 spring 사용 예시
접속시 관련 정보를 표시해 준다.
@Timed(value="users.welcome", longTask=true)
public String welcome(){
    return greeting.getMessage();
}
Prometheus + Grafana
Prometheus에 저장된 데이터를 바탕으로 Grafana에서 모니터링 한다.
Prometheus
- Metrics를 수집하고 모니터링, 알람에 사용되는 오픈소스
- 시계열 DB에 Metrics를 저장, 조회
Grafana
- 데이터 시각화, 모니터링 및 분석을 위한 오픈소스
- Prometheus 다운 https://prometheus.io/download/
- prometheus.yml 수정
scrape_configs:
  - job_name: '<서비스 이름>'
    scrape_interval: 15s
    metrics_path: '<actuator 의 prometheus 주소>.../actuator/prometheus'
    static_config:
      - targets: ['<서버 주소 배열로 입력>']
- Prometheus 실행
./prometheus --config.file-prometheus.yml
확인 http://127.0.0.1:9000
- Grafana 다운로드 https://grafana.com/grafana/download
- 실행 http://127.0.0.1:3000 admin, admin
- Prometheus 데이터 소스 추가하기 Permalink
- 그라파나 대시보드의 좌측 메뉴에서, Home > Connections > Data sources 를 클릭
- Add data source 버튼을 클릭
- 사용 가능한 데이터 소스 목록에서 Prometheus를 찾아 선택
- 다음 정보를 입력
- Name: 데이터 소스의 이름을 입력
- URL: Prometheus 서버의 주소를 입력. 예: http://localhost:9090
- 나머지 설정은 기본값을 사용해도 괜찮지만, 특정 환경에 맞추어 조정할 수 있다.
- Save & Test 버튼을 클릭하여 설정을 저장하고, 데이터 소스 연결을 테스트 한다.
- 대시보드를 받고 적용 한다. https://grafana.com/grafana/dashboards/
- 대시보드의 나오지 않는 데이터들을 보정해 준다.
- 데이터명을 클릭하면 메뉴가 나온다. Edit을 선택 한다.
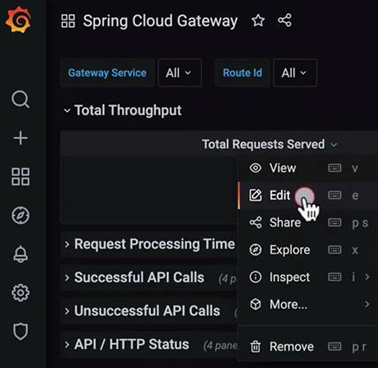
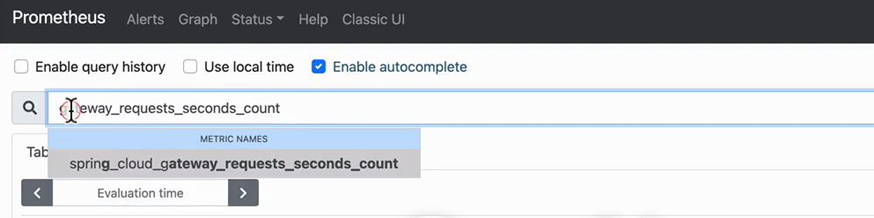
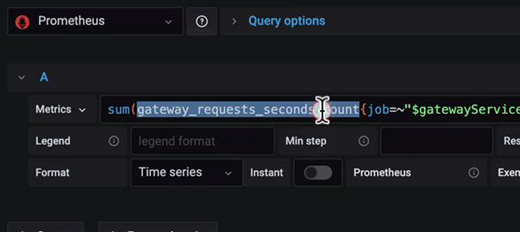
- 하단에서 Metrics 정보를 수정해 준다. (Prometheus 에서 유추 혹은 검색)
- 데이터명을 클릭하면 메뉴가 나온다. Edit을 선택 한다.